Raška, Serbia
Raška
Рашка (Serbian) | |
|---|---|
Town and municipality | |
Raška | |
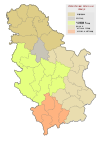
 Location of the municipality of Raška within Serbia | |
| Coordinates: 43°17′31″N 20°36′56″E / 43.29194°N 20.61556°E | |
| Country | |
| Region | Šumadija and Western Serbia |
| District | Raška |
| Settlements | 61 |
| Government | |
| • Mayor | Nemanja Popović (SNS) |
| Area | |
| • Town | 3.90 km2 (1.51 sq mi) |
| • Municipality | 670 km2 (260 sq mi) |
| Elevation | 497 m (1,631 ft) |
| Population (2022 census) | |
| • Town | 6,291 |
| • Town density | 1,600/km2 (4,200/sq mi) |
| • Municipality | 21,498 |
| • Municipality density | 32/km2 (83/sq mi) |
| Time zone | UTC+1 (CET) |
| • Summer (DST) | UTC+2 (CEST) |
| Postal code | 36350 |
| Area code | +381(0)36 |
| Car plates | RA |
| Website | www |
Raška (Serbian Cyrillic: Рашка, pronounced [râʃkaː]) is a town and municipality located in the Raška District of southwestern Serbia. The municipality has a population of 21,498 people, while the town has a population of 6,291 people (2022 census).[2] It covers an area of 670km2 (259 sq. mi.). The town is situated on the rivers Raška and Ibar.
History
[edit]The town and municipality bears the name of the historical Raška region. It was the first Nemanjić’s independent country and the center of culture and the statehood of Serbs in the middle ages.[3]
Raška as a settlement was first mentioned in 1835 and the first Urban Plan of Raška dates back to 1844.[3] From 1929 to 1941, Raška was part of the Zeta Banovina of the Kingdom of Yugoslavia.
Demographics
[edit]| Year | Pop. | ±% p.a. |
|---|---|---|
| 1948 | 25,837 | — |
| 1953 | 28,008 | +1.63% |
| 1961 | 29,856 | +0.80% |
| 1971 | 29,367 | −0.17% |
| 1981 | 29,475 | +0.04% |
| 1991 | 28,747 | −0.25% |
| 2002 | 26,981 | −0.57% |
| 2011 | 24,678 | −0.99% |
| 2022 | 21,498 | −1.25% |
| Source: [4] | ||
According to the 2011 census results, the municipality of Raška has 24,678 inhabitants.
Ethnic groups
[edit]The ethnic composition of the municipality:[5]
| Ethnic group | Population | % |
|---|---|---|
| Serbs | 24,135 | 97.80% |
| Romani | 202 | 0.82% |
| Montenegrins | 45 | 0.18% |
| Macedonians | 21 | 0.09% |
| Albanians | 12 | 0.05% |
| Gorani | 12 | 0.05% |
| Others | 251 | 1.02% |
| Total | 24,678 |
Economy
[edit]The following table gives a preview of total number of registered people employed in legal entities per their core activity (as of 2018):[6]
| Activity | Total |
|---|---|
| Agriculture, forestry and fishing | 97 |
| Mining and quarrying | 460 |
| Manufacturing | 826 |
| Electricity, gas, steam and air conditioning supply | 110 |
| Water supply; sewerage, waste management and remediation activities | 141 |
| Construction | 197 |
| Wholesale and retail trade, repair of motor vehicles and motorcycles | 776 |
| Transportation and storage | 358 |
| Accommodation and food services | 816 |
| Information and communication | 77 |
| Financial and insurance activities | 38 |
| Real estate activities | 15 |
| Professional, scientific and technical activities | 93 |
| Administrative and support service activities | 149 |
| Public administration and defense; compulsory social security | 455 |
| Education | 459 |
| Human health and social work activities | 205 |
| Arts, entertainment and recreation | 219 |
| Other service activities | 114 |
| Individual agricultural workers | 112 |
| Total | 5,745 |
Gallery
[edit]-
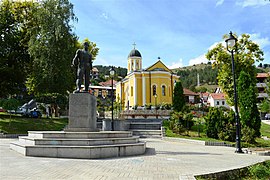
Town center square
-
Town center square
-
Train station in Raška
-
Church of St. Archangel
-
Park in Jošanička Banja
-
Baljevac na Ibru town panorama
-
Brvenik village panorama
-
Brvenik village panorama
Notable people
[edit]- Branko Jovicic, Serbian and Red Star football player
- Savatije Milošević, Serbian hajduk and Chetnik commander, born in Pavlica
- Serbian Patriarch German
- Goran Bogdanović, Serbian politician
- Milenković family (Svetozar Milenković (1907-1983), Vida Milenković (1912-1992), and Aleksandar Petrović), Righteous Among the Nations
- Mihailo Petrović (1871-1941), Chetnik
- Milunka Savić, Serbian WWI hero
- Saša Knežević-Gurman, Serbian gerila
See also
[edit]References
[edit]- ^ "Municipalities of Serbia, 2006". Statistical Office of Serbia. Retrieved 2010-11-28.
- ^ "Census 2022 - excel table | ABOUT CENSUS". popis2022.stat.gov.rs. Retrieved 2024-09-10.
- ^ a b "Raška | Туристичка организација Рашка". raskaturizam.rs. Retrieved 2024-09-10.
- ^ "2011 Census of Population, Households and Dwellings in the Republic of Serbia" (PDF). stat.gov.rs. Statistical Office of the Republic of Serbia. Retrieved 11 January 2017.
- ^ "Попис становништва, домаћинстава и станова 2011. у Републици Србији" (PDF). stat.gov.rs. Republički zavod za statistiku. Retrieved 14 January 2017.
- ^ "MUNICIPALITIES AND REGIONS OF THE REPUBLIC OF SERBIA, 2019" (PDF). stat.gov.rs. Statistical Office of the Republic of Serbia. 25 December 2019. Retrieved 28 December 2019.
External links
[edit]


