
List of administrative divisions of Greater China by Human Development Index
| Province-level divisions of China by: |
|---|
This is a list of the first-level administrative divisions of the People's Republic of China (PRC), including all provinces, autonomous regions, municipalities, and special administrative regions in order of their Human Development Index (HDI), along with the Republic of China (ROC, Taiwan). The subnational and national average figures for the PRC/ROC division are mainly derived from the Subnational Human Development Index (SHDI), published by the Global Data Lab at Radboud University. The index does not cover Macau, a special administrative region of the PRC. Only divisions of Mainland China are given ranking numbers in the list as the national HDI for China, which is calculated by the annual UNDP Human Development Report, is exclusively applied to the mainland.
List of administrative divisions by HDI
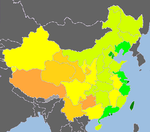
[edit].svg)
The Subnational Human Development Database (2022 data)
[edit]Notes:
- ^ a b Hong Kong and Macau are special administrative regions of the People's Republic of China.
- ^ Taiwan is under separate rule by the Republic of China as a de facto independent state since 1950, but is claimed by the People's Republic of China as a province. The ROC also claims the mainland as its constitutional-defined territory.[3]
- ^ The HDI annual report compiled by the UNDP does not include Taiwan because it is no longer a UN member state, and is neither included as part of the People's Republic of China by both of the UNDP and SHDI reports when calculating data for China.[4][1] Taiwan's Statistical Bureau calculated its HDI for 2022 to be 0.925 based on UNDP's 2010 methodology,[5][6] which would place Taiwan at 24th globally in 2022 within the 2024 UNDP report.
- ^ Macao's HDI is not included in the SHDI database or any UNDP annual report. According to the 2024 annual report published by Statistics and Census Service of the Government of Macao Special Administrative Region, the HDI for Macau was predicted at 0.925 in 2022.[7]
- ^ Figures refer to mainland China only.[8]
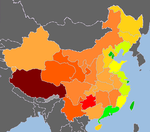
Trend
[edit]| Legend | ||||
|---|---|---|---|---|
|
Very High human development 0.900 and above
0.850–0.899
0.800–0.849
|
High human development 0.750–0.799
0.700–0.749
|
Medium human development 0.650–0.699
0.600–0.649
0.550–0.599
|
Data unavailable
| |
- 2010-2014 HDI
-
 2014 data
 -
 2010 data


| Legend | ||||
|---|---|---|---|---|
|
Very High human development 0.900–0.949
|
High human development 0.850–0.899
0.800–0.849
|
Medium human development 0.750–0.799
0.700–0.749
0.650–0.699
0.600–0.649
0.550–0.599
0.500–0.549
|
Low human development 0.450–0.499
0.400–0.449
0.350–0.399
|
Data unavailable
|
- 1982-2008 HDI
-
 2008 data
 -
 2005 data
 -
 2003 data
 -
 1999 data
 -
 1997 data
 -
 1995 data
 -
 1990 data
 -
 1982 data


See also
[edit]References
[edit]- ^ a b "Human Development Indices (8.0)- China". Global Data Lab. Retrieved 23 September 2024.
- ^ "Human Development Report 2023/2024" (PDF). United Nations Development Programme.
- ^ "Taiwan Country Profile". World Affairs Journal. Retrieved 2020-08-29.
- ^ "Human Development Report 2020: Reader's Guide". United Nation Development Program. 2020. Retrieved 12 March 2021.
- ^ "What is the human development index (HDI)? How are relevant data queried?" (PDF). Directorate General of Budget, Accounting and Statistics, Executive Yuan, Taiwan (ROC). Retrieved 14 March 2021.
- ^ "人類發展指數(Human Development Index, HDI)" (PDF) (in Chinese (Taiwan)). Directorate General of Budget, Accounting and Statistics, Executive Yuan, Taiwan (ROC). 6 January 2011. Retrieved 13 March 2021.
- ^ "Macau in Figures, 2024". 澳門統計暨普查局(DSEC). p. 4. Retrieved 2021-06-09.
- ^ "Human Development Report 2023-24: Reader's Guide" (PDF). United Nation Development Program. 2022. Retrieved 13 March 2024.