
File:Nz-gas-production-m3.svg

Size of this PNG preview of this SVG file: 578 × 434 pixels. Other resolutions: 320 × 240 pixels | 639 × 480 pixels | 1,023 × 768 pixels | 1,280 × 961 pixels | 2,560 × 1,922 pixels.
Original file (SVG file, nominally 578 × 434 pixels, file size: 8 KB)
| This is a file from the Wikimedia Commons. Information from its description page there is shown below. Commons is a freely licensed media file repository. You can help. |
Summary
| Description |
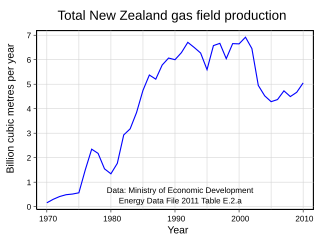
English: New Zealand gas production in million cubic metres per year. Source : Ministry of Economic Development Energy Data File 2011 Table E.2.a |
| Date | |
| Source | Own work |
| Author | Mrfebruary |
| SVG development | This file uses embedded text that can be easily translated using a text editor. |
| Source code | R code//Download "edfe2a.csv" from https://docs.google.com/spreadsheet/ccc?key=0AsLhMBA3NXL4dElpNnJHR0dqRG90LU9FVlg4UkZITmc
to your working R directory.
e2 <- read.csv("edfe2a.csv", skip= 5,header=TRUE, sep=",", na.strings=-99, dec=".", strip.white=TRUE)
str(e2) ## examine object ##
'data.frame': 41 obs. of 14 variables:
$ Year : int 1970 1971 1972 1973 1974 1975 1976 1977 1978 1979 ...
$ Maui : int NA NA NA NA NA NA NA NA NA 468 ...
$ Kapuni : int 158 301 414 488 515 566 1502 2347 2175 1077 ...
$ McKee : int NA NA NA NA NA NA NA NA NA NA ...
$ Mangahewa : int NA NA NA NA NA NA NA NA NA NA ...
$ Kaimiro..Ngatoro: int NA NA NA NA NA NA NA NA NA NA ...
$ Turangi : int NA NA NA NA NA NA NA NA NA NA ...
$ Kowhai : int NA NA NA NA NA NA NA NA NA NA ...
$ Pohokura : int NA NA NA NA NA NA NA NA NA NA ...
$ Tui : int NA NA NA NA NA NA NA NA NA NA ...
$ Maari : int NA NA NA NA NA NA NA NA NA NA ...
$ Kupe : int NA NA NA NA NA NA NA NA NA NA ...
$ Other : int NA NA NA NA NA NA NA NA NA NA ...
$ Total : int 158 301 414 488 515 566 1502 2347 2175 1545 ...
library("RSVGTipsDevice")
devSVGTips(file="nz-gas-production-m3.svg",toolTipMode=0,width=8,height=6)
par(mar=c(5,6,5,1)+0.1,cex.main=1.5,cex.lab=1.2)
plot(e2$Year,e2$Total/1000,type='n',las=1,axes=FALSE,lwd=1,xlab="",ylab="")
box(lwd=2)
abline(h=c(0.5,1,1.5,2,2.5),col='lightgray',lwd=1)
abline(v=c(1970,1980,1990,2000,2010),col='lightgray',lwd=1)
mtext(side=1,line=-2,"Data: Ministry of Economic Development \nEnergy Data File 2011 Table E.2.a")
axis(side=1, at = NULL, labels = TRUE, tick = TRUE)
axis(side=2, las=2,at = NULL, labels = TRUE, tick = TRUE)
title(col.main="black", cex.lab=1, main="Total New Zealand gas field production",xlab="Year", ylab="Billion cubic metres per year")
lines(e2$Year,e2$Total/1000, col=4,lwd=2)
dev.off()
|
Data
Ministry of Economic Development Energy Data File 2011 Spread Sheet E Gas Work sheet Table E.2a: Total Natural Gas Production by Field (Mm3) has been copied from the EDF 2011 spreadsheets to: https://docs.google.com/spreadsheet/ccc?key=0AsLhMBA3NXL4dElpNnJHR0dqRG90LU9FVlg4UkZITmc where it is saved as "edfe2a.csv"
Licensing
I, the copyright holder of this work, hereby publish it under the following license:
This file is licensed under the Creative Commons Attribution-Share Alike 3.0 Unported license.
- You are free:
- to share – to copy, distribute and transmit the work
- to remix – to adapt the work
- Under the following conditions:
- attribution – You must give appropriate credit, provide a link to the license, and indicate if changes were made. You may do so in any reasonable manner, but not in any way that suggests the licensor endorses you or your use.
- share alike – If you remix, transform, or build upon the material, you must distribute your contributions under the same or compatible license as the original.
File history
Click on a date/time to view the file as it appeared at that time.
| Date/Time | Thumbnail | Dimensions | User | Comment | |
|---|---|---|---|---|---|
| current | 10:32, 31 May 2012 | | 578 × 434 (8 KB) | Mrfebruary | larger font sizes |
| 11:08, 29 May 2012 |  | 578 × 434 (8 KB) | Mrfebruary |
File usage
The following page uses this file:
Global file usage
The following other wikis use this file:
- Usage on de.wikipedia.org