
File:Mpl example Helmoltz coils.svg

Size of this PNG preview of this SVG file: 540 × 540 pixels. Other resolutions: 240 × 240 pixels | 480 × 480 pixels | 768 × 768 pixels | 1,024 × 1,024 pixels | 2,048 × 2,048 pixels.
Original file (SVG file, nominally 540 × 540 pixels, file size: 63 KB)
| This is a file from the Wikimedia Commons. Information from its description page there is shown below. Commons is a freely licensed media file repository. You can help. |
Summary
| Description |
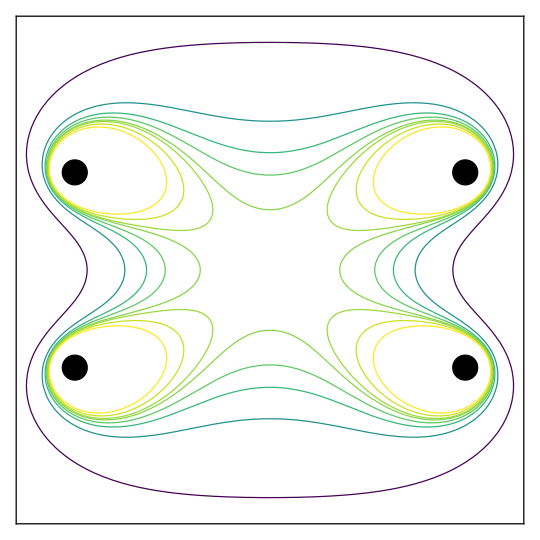
English: Cross section of B (magnetic field strength) magnitude in a Helmholtz coil (actually consisting of two coils: one at the top, one at the bottom in the plot). The eight contours are for field magnitudes of 0.5 {\displaystyle B_0}, 0.8 {\displaystyle B_0}, 0.9 {\displaystyle B_0}, 0.95 {\displaystyle B_0}, 0.99 {\displaystyle B_0}, 1.01 {\displaystyle B_0}, 1.05 {\displaystyle B_0}, and 1.1 {\displaystyle B_0}, where {\displaystyle B_0} is field strength at center. The large center area has almost uniform field strength. |
| Date | |
| Source | Own work |
| Author | Adrien F. Vincent |
| SVG development | This plot was created with Matplotlib. |
Rationale: this work aims at providing an up-to-date version of the similar work https://commons.wikimedia.org/wiki/File:Helmholtz_coil,_B_magnitude_cross_section.svg, done by Morn.
Source code has been modified into fully object-oriented matplotlib interface. It now uses the "viridis" colormap, instead of "jet" which produces perceptual glitches. Besides, some changes had to be done to work with versions of numpy more recent than the one originally used.
The matplotlib (mpl) version is 1.5.3, with Python 2.7 and numpy 1.10
##########
## Code for the figure
##########
# -*- coding: utf-8 -*-
from __future__ import division

import matplotlib.pyplot as plt
import numpy as np

from matplotlib.cm import viridis as colormap  # future default colormap

"""
Setup
"""
r = 1.0
res = 200  # grid resolution. 100 may be enough, resulting in smaller SVG file)

def dist3(a, b, c, d, e, f):
    """Compute the Euclidian distance from (d, e, f) to (a, b, c),
    raised to the 3rd power (and with lower boundary `r`).
    """
    return np.maximum(r, np.sqrt((a - d)**2 + (b - e)**2 + (c - f)**2))

x = np.linspace(-150, 150, res)
y = np.linspace(-150, 150, res)
X, Y = np.meshgrid(x, y)
F = np.zeros((res, res, 3))

"""
Computing part
"""
# Loop over two coils
for coils in [1.0, -1.0]:
    # Sum field contributions from coil in 10-degree steps
    for p in np.arange(0, 360, 10):
        xc = 100 * np.sin(np.pi * p / 180.0)
        yc = 50 * coils
        zc = 100 * np.cos(np.pi * p / 180.0)
        MAG = 1.0 / ((r + dist3(X, Y, 0.0, xc, yc, zc))**3)
        # (We leave out the necessary constants that would be required
        # to get proper units because only scaling behavior will be shown
        # in the plot. This is also why a sum instead of an integral
        # can be used.)
        #
        # Due to more stringent casting rules in recent Numpy (>=1.10),
        # one builds an explicit list of all the vectors (X - xc, Y - yc, -zc)
        # instead of relying on broadcasting. One then reshapes the array Z
        # (of the cross-product results) as previously expected.
        vectors = np.array([[xval - xc, yval - yc, -zc] for (xval, yval)
                            in zip(X.reshape(-1), Y.reshape(-1))])
        Z = np.cross(vectors, (-zc, 0.0, xc))
        Z = Z.reshape(res, res, 3)
        F += Z * MAG[:,:,np.newaxis]

# Compute the B-field
B = np.sqrt(F[..., 0]**2 + F[..., 1]**2 + F[..., 2]**2)
# Scale field strength by value at center
B = B / B[res // 2, res // 2]

"""
Plotting part
"""
fig_label = "helmoltz_coils"
plt.close(fig_label)
fig, ax = plt.subplots(figsize=(6, 6), num=fig_label, frameon=False)

levels = (0.5, 0.8, 0.9, 0.95, 0.99, 1.01, 1.05, 1.1)
cs = ax.contour(x, y, B, cmap=colormap, levels=levels)

# Add wire symbols
ax.scatter((100, 100, -100, -100), (50, -50, 50, -50), s=400, color="Black")

ax.axis((-130, 130, -130, 130))
ax.set_xticks([])
ax.set_yticks([])

plt.tight_layout()
plt.show()

fig.savefig("Helmholtz_coil,_B_magnitude_cross_section.svg")
##########
Licensing
I, the copyright holder of this work, hereby publish it under the following license:
This file is licensed under the Creative Commons Attribution-Share Alike 4.0 International license.
- You are free:
- to share – to copy, distribute and transmit the work
- to remix – to adapt the work
- Under the following conditions:
- attribution – You must give appropriate credit, provide a link to the license, and indicate if changes were made. You may do so in any reasonable manner, but not in any way that suggests the licensor endorses you or your use.
- share alike – If you remix, transform, or build upon the material, you must distribute your contributions under the same or compatible license as the original.
File history
Click on a date/time to view the file as it appeared at that time.
| Date/Time | Thumbnail | Dimensions | User | Comment | |
|---|---|---|---|---|---|
| current | 09:52, 27 September 2016 | | 540 × 540 (63 KB) | Adrien F. Vincent | User created page with UploadWizard |
File usage
The following pages on the English Wikipedia use this file (pages on other projects are not listed):
Global file usage
The following other wikis use this file:
- Usage on bn.wikipedia.org
- Usage on ko.wikipedia.org
- Usage on pt.wikipedia.org
- Usage on tr.wikipedia.org
- Usage on zh.wikipedia.org